Simpler Serverless Framework Python Dependencies

A few months ago I released Lovage. It’s a Python only serverless library that’s focused more on RPC and less on HTTP and events. One of my favorite features was the simple dependency management. All external dependencies are handled in a serverless fashion. Other frameworks/libraries locally download all the dependencies (which often requires cross downloading/compiling with Docker), package them up, and then upload them with every code change. Lovage does this all in a Lambda function and stores the dependencies in a Lambda layer. It saves a lot of time, especially for minor code changes that don’t update dependencies.

Recently I needed to create some smaller serverless projects that do use events and HTTP. I turned back to Serverless Framework. But instead of using the good old serverles-python-requirements, I decided to create serverless-pydeps. It’s another Serverless Framework plug-in that handles Python dependencies the same way as Lovage. By not handling dependency collection locally, it gains the same speed advantages as Lovage.

If you want to use it yourself, run the following command. No further configuration is needed.

sls plugin install -n serverless-pydeps

Even with a large requirements.txt file, the upload is still tiny and deployment is quick.

Mounting Configuration Files in Fargate

A lot of Docker images, like nginx, support configuration using files. The documentation recommends that you create the file locally and then mount it to your container with -v /host/path/nginx.conf:/etc/nginx/nginx.conf:ro. Other images, like grafana and redis, support similar configuration methods.

But this method doesn’t work on Fargate because the server running your containers doesn’t have access to your local files. So how can you mount configuration files into containers in Fargate?

One option is baking the configuration file into your image. The downside is that this requires building, storing, and maintaining your own image. It also makes changing your configuration much more difficult.

A simpler method is using a sidecar container that writes the configuration to a volume shared by both containers. The sidecar container uses images like bash or amazon/aws-cli. It can read the configuration from an environment variable, from SSM or even S3.

To add a sidecar container to your existing task definition:

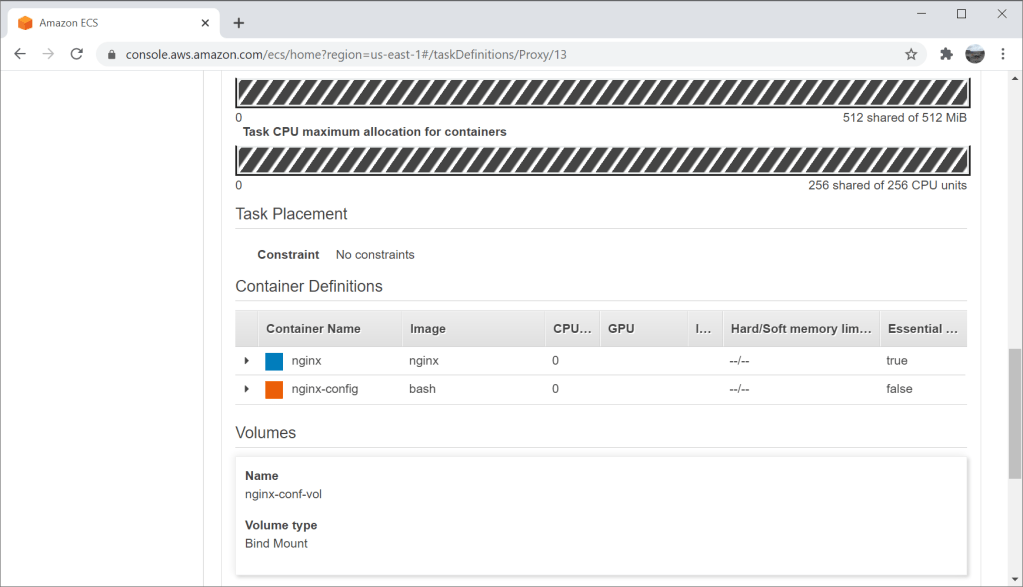
  1. Define a transient volume. When doing this in Fargate Console select Bind Mount type.
  2. Add a new sidebar container definition to your task. Use bash or amazon/aws-cli as the image.
  3. Mount the new volume into your new sidecar container.
  4. Update the command of sidecar container to read the configuration and write it to the mounting point.
  5. Update your existing container definition to also mount the same volume to where the image is expecting the configuration file.
  6. Set your existing container to depend on the new sidecar container to avoid any race conditions.

For example, if we want to configure nginx container using the following configuration file, we can use bash to write it to /etc/nginx/nginx.conf. To avoid any issues with newlines, we will base64 encode the configuration file and put it in the environment of the sidecar container.

events {
  worker_connections  1024;
}

http {
  server {
    listen 80;
    location / {
      proxy_pass https://kichik.com;
    }
  }
}

All this takes just a few lines with CloudFormation but can be done using other APIs as well. As you can see, this template defines a task definition with two containers. One container is nginx itself, and the other is the sidecar container. Both of them mount the same volume. The main container depends on the sidecar container. The sidecar container takes the configuration from the environment, decodes it using base64 and writes it to /etc/nginx/nginx.conf. Since both containers use the same volume, the main container will see and use this configuration file.

Resources:
  FargateTask:
    Type: AWS::ECS::TaskDefinition
    Properties:
      NetworkMode: awsvpc
      RequiresCompatibilities:
        - FARGATE
      Cpu: 256
      Memory: 512
      Volumes:
        - Name: nginx-conf-vol
          Host: {}
      ContainerDefinitions:
        - Name: nginx
          Image: nginx
          Essential: true
          DependsOn:
          - Condition: COMPLETE
            ContainerName: nginx-config
          PortMappings:
            - ContainerPort: 80
          MountPoints:
            - ContainerPath: /etc/nginx
              SourceVolume: nginx-conf-vol
        - Name: nginx-config
          Image: bash
          Essential: false
          Command:
            - -c
            - echo $DATA | base64 -d - | tee /etc/nginx/nginx.conf
          Environment:
            - Name: DATA
              Value:
                Fn::Base64: |
                  events {
                    worker_connections  1024;
                  }
                  
                  http {
                    server {
                      listen 80;
                      location / {
                        proxy_pass https://kichik.com;
                      }
                    }
                  }
          MountPoints:
            - ContainerPath: /etc/nginx
              SourceVolume: nginx-conf-vol

After deploying this template, you can launch a Fargate task and the result will be a simple web server proxying all requests back to this blog.

This is a very raw example. You would usually want to enable logs, and get configuration from somewhere dynamic in production. But it shows the basics of this sidecar method and can be applied to any Docker image that requires mounting a configuration file.

How Do EC2 Instance Profiles Work?

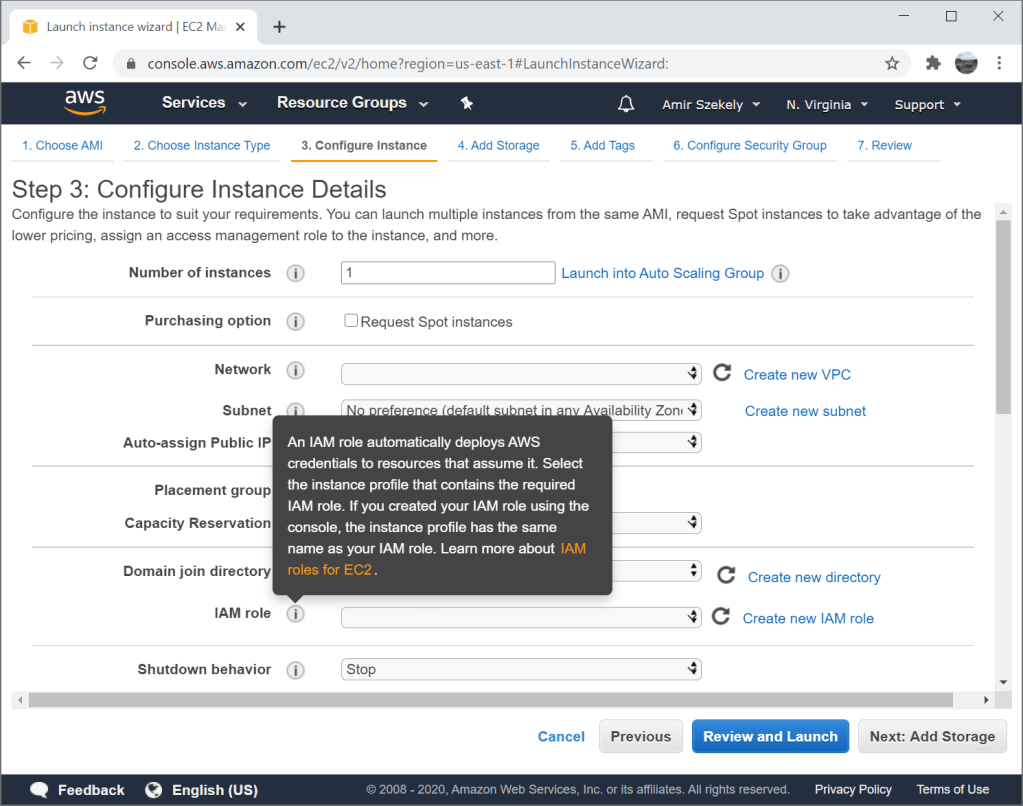
EC2 instance profiles allow you to attach an IAM role to an EC2 instance. This allows any application running on the instance to access certain resources defined in the role policies. Instance profiles are usually recommended over configuring a static access key as they are considered more secure and easier to maintain.

  1. Instance profiles do not require users to deal with access keys. There is one less secret to securely store and one less secret that can leak.
  2. Instance profiles can be replaced or removed using EC2 API or in EC2 Console. There is no need to make your application configuration dynamic to change or revoke permissions.
  3. Instance profiles, and roles in general, provide temporary credentials per-use. If those credentials leak, the damage is contained to their lifespan.

But how does an application running on EC2 use this instance profile? Where do the credentials come from? How does this work without any application configuration change?

EC2 shares the credentials with the application through the metadata service. Each instance can access this service through http://169.254.169.254 (unless disabled) and EC2 will expose instance-specific information there. The exposed information includes AMI id, user-data, instance id and IPs, and more.

The instance profile credentials are exposed on http://169.254.169.254/latest/meta-data/iam/security-credentials/. When you curl this URL on an EC2 instance, you will get the name of the instance profile attached to the instance. When you curl the same URL with the instance profile name at the end, you get the temporary credentials as JSON. The metadata service will return access key id, secret access key, a token, and the expiration date of the temporary credentials. Behind the scenes it is using STS AssumeRole.

All this data can be used to configure any application to use the role attached to the instance profile. You just have to be careful not to use it past the expiration date. You must also remember to check for new temporary credentials once the expiration date passes. If you are going to use these credentials manually, remember that the token is required. Normal user access keys don’t have a token, but temporary credentials require it.

To save you on curl calls and to automate this process further, all AWS SDKs check the instance profile for credentials first. As you can see in the source code, this is exactly what the Python SDK, botocore, does to get credentials from the instance profile. In the end, everything just works as expected, and no application configuration is required.

How Does AWS EBS Expand Volumes?

Migrating from a small hard drive to a bigger hard drive usually means copying the raw data of the drive using dd, increasing the partition size using cfdisk, and then finally resizing the file system to fit the whole partition with something like resize2fs. This process is usually done while booted from another drive or live USB, but it is possible to modify partitions on mounted drives in relatively modern systems.

This process is always scary and time consuming, especially when booting from another drive. Any small mistake can brick your drive and cause data loss. And whether you use a nice GUI utility like gparted or not, there are many steps that can go very wrong if you’re not paying attention. The recommended backup step makes this process even longer.

All the complexity and potential for data loss made me appreciate EBS even more. It was a pleasent surprise when my file system was automatically the right size after a few button clicks in EBS. I didn’t even SSH into the machine and it was done. Just modify the EBS volume while the machine is running and reboot when it’s done (it is possible to skip the reboot but you would have to extend the partition manually).

So how does this work? Does EBS automatically modify the partition and resize the file system? Is the volume attached to a hidden EC2 instance that handles it for you? Is it something else?

It is your EC2 instance itself that extends the partition and resizes the file system. This is done automatically by cloud-init which is a program that comes preloaded on most AMIs. This program is in charge of initializing cloud instances and works on AWS, GCP, Azure, and others. It can take care of common tasks like retrieving instance metadata, setting up SSH keys, and it even executes UserData on AWS.

If you check out the log file at /var/log/cloud-init.log after increasing a volume size and rebooting, you will find something like the following.

Sep 03 23:58:49 cloud-init[2276]: cc_growpart.py[DEBUG]: No 'growpart' entry in cfg.  Using default: {'ignore_growroot_disabled': False, 'mode': 'auto', 'devices': ['/']}
Sep 03 23:58:49 cloud-init[2276]: util.py[DEBUG]: Running command ['growpart', '--dry-run', '/dev/nvme0n1', '1'] with allowed return codes [0] (shell=False, capture=True)
Sep 03 23:58:49 cloud-init[2276]: util.py[DEBUG]: Running command ['growpart', '/dev/nvme0n1', '1'] with allowed return codes [0] (shell=False, capture=True)
Sep 03 23:58:50 cloud-init[2276]: util.py[DEBUG]: resize_devices took 0.116 seconds
Sep 03 23:58:50 cloud-init[2276]: cc_growpart.py[INFO]: '/' resized: changed (/dev/nvme0n1, 1) from 8587820544 to 10735304192
Sep 03 23:58:50 cloud-init[2276]: stages.py[DEBUG]: Running module resizefs (<module 'cloudinit.config.cc_resizefs' from '/usr/lib/python2.7/site-packages/cloudinit/config/cc_resizefs.pyc'>) with frequency always
Sep 03 23:58:50 cloud-init[2276]: handlers.py[DEBUG]: start: init-network/config-resizefs: running config-resizefs with frequency always
Sep 03 23:58:50 cloud-init[2276]: helpers.py[DEBUG]: Running config-resizefs using lock (<cloudinit.helpers.DummyLock object at 0x7fd3a1a50290>)
Sep 03 23:58:50 cloud-init[2276]: cc_resizefs.py[DEBUG]: resize_info: dev=/dev/nvme0n1p1 mnt_point=/ path=/
Sep 03 23:58:50 cloud-init[2276]: cc_resizefs.py[DEBUG]: Resizing / (xfs) using xfs_growfs /
Sep 03 23:58:50 cloud-init[2276]: cc_resizefs.py[DEBUG]: Resizing (via forking) root filesystem (type=xfs, val=noblock)
Sep 03 23:58:50 cloud-init[2452]: util.py[DEBUG]: Running command ('xfs_growfs', '/') with allowed return codes [0] (shell=False, capture=True)

Notice cloud-init detected the volume size changed, automatically called growpart with the right parameters to increase the partition size to fill the volume, detected the file system type, and called xfs_growfs to grow the file system.

cloud-init is configured with /etc/cloud/cloud.cfg which contains various configuration and a list of all the modules that should be executed. On most AMIs this includes the two modules we saw in the log: growpart and resizefs which are loaded from cc_growpart.py and cc_resizefs.py. In the source code you can see all the magic of detecting the size, file system, and choosing the right tools for the job.

This solution allows EBS to remain simple and file-system agnostic, while providing good yet configurable user experience. I was pretty impressed when I realized how it works.

Sanitized RDS Snapshots

Testing on production data is very useful to root out real-life bugs, take user behavior into account, and measure real performance of your system. But testing on production databases is dangerous. You don’t want the extra load and you don’t want the potential of data loss. So you make a copy of your production database and before you know it has been two years, the data is stale and the schema has been manually modified beyond recognition. This is why I created RDS-sanitized-snapshots. It periodically takes a snapshot, sanitizes it to remove data the developers shouldn’t access like credit card numbers, and then optionally share with other AWS accounts.

As usual it’s one CloudFormation template that can be deployed in one step. The template is generated using Python and troposphere.

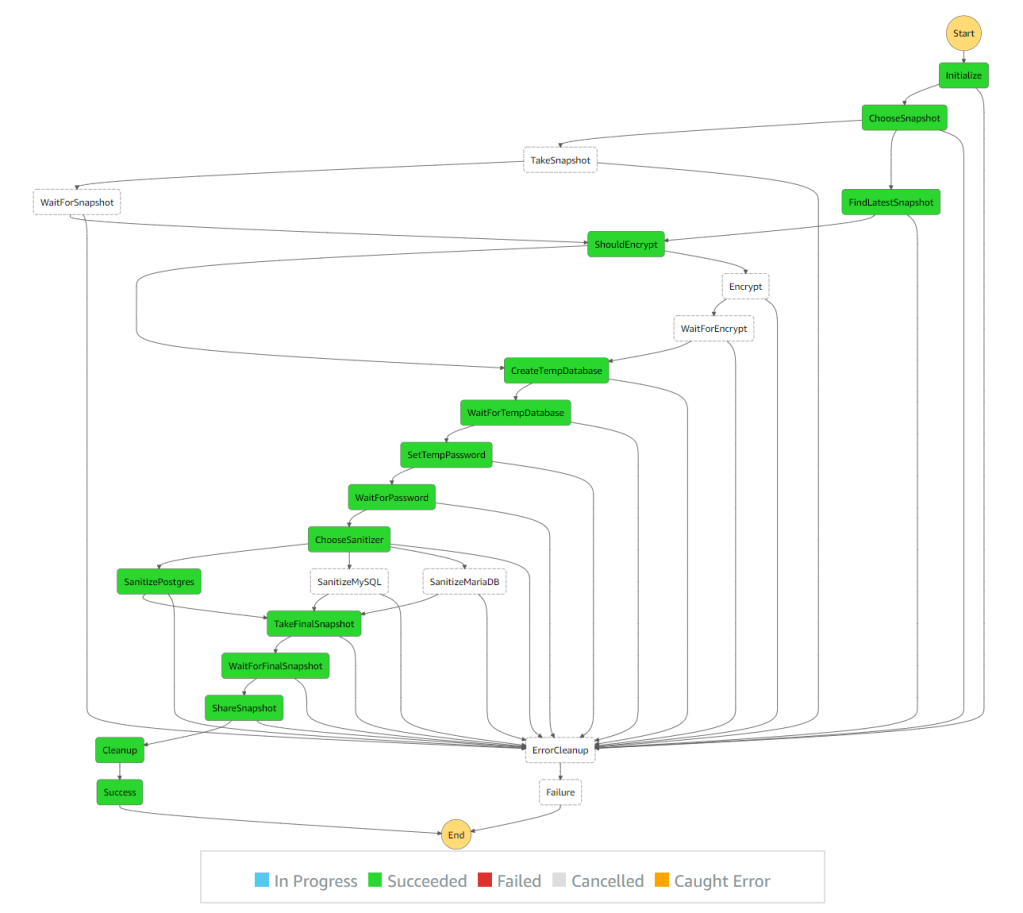
There are many examples around the web that do parts of this. I wanted to create a complete solution that doesn’t require managing access keys and can be used without any servers. Since all of the operations take a long time and Lambda has a 15 minutes time limit, I decided it’s time to play with Step Functions. Step Functions let you create a state machine that is capable of executing Lambda functions and Fargate tasks for each step. Defining retry and wait logic is also built-in so there is no need for long running Lambda functions or EC2 instances. It even shows you the state in a nice graph.

To create a sanitized snapshot we need to:

  1. Create a temporary copy of the production database so we don’t affect the actual data or the performance of the production system. We do this by taking a snapshot of the production database or finding the latest available snapshot and creating a temporary database from that.
  2. Run configured SQL queries to sanitize the temporary database. This can delete passwords, remove PII, etc. Since database operations can take a long time, we can’t do this in Lambda due to its 15 minutes limit. So instead we create a Fargate task that connects to the temporary database and executes the queries.
  3. Take a snapshot of the temporary database after it has been sanitized. Since this process is meant to be executed periodically, the snapshot name needs to be unique.
  4. Share snapshot with QA and development accounts.
  5. Clean-up temporary snapshots and databases.

If the database is encrypted we might also need to re-encrypt it with a key that can be shared with the other accounts. For that purpose we have a KMS key id option that adds another step of copying the snapshot over with a new key. There is no way to modify the key of an existing database or snapshot besides when copying the snapshot over to a new snapshot. Sharing the key is not covered by this solution.

The step function handles all the waiting by calling the Lambda handler to check if it’s ready. If it is ready, we can move on to the next step. If it’s not ready, it throws a specific NotReady exception and the step function retries in 60 seconds. The default retry parameters are maximum of 3 retries with each wait twice as long as the previous one. Since this is not a real failure but an expected one, we can increase the number of retries and remove the backoff logic that doubles the waiting time.

{
  "States": {
    "WaitForSnapshot": {
      "Type": "Task",
      "Resource": "${HandlerFunction.Arn}",
      "Parameters": {
        "state_name": "WaitForSnapshot",
      },
      "Next": "CreateTempDatabase",
      "Retry": [
        {
          "ErrorEquals": [
            "NotReady"
          ],
          "IntervalSeconds": 60,
          "MaxAttempts": 300,
          "BackoffRate": 1
        }
      ]
    }
  }
}

One complication with RDS is networking. Since databases are not accessed using AWS API (and RDS Data API only supports Aurora), the Fargate task needs to run in the same network as the temporary database. We can theoretically create the temporary database in the same VPC, subnet and security group as the production database. But that would require modifying the security group of the production database and can pose a potential security risk or data loss risk. It’s better to keep the temporary and production databases separate to avoid even the remote possibility of something going wrong by accident.

Another oddity I’ve learned from this is that Fargate tasks with no route to the internet can’t use Docker images from Docker Hub. I would have expected the image pulling to be separate from the execution of the task itself like it was with AWS Batch, but that’s not the case. This is why the Fargate task is created with a public facing IP. I tried using Amazon Linux Docker image from ECR, but even that requires an internet route or VPC Endpoint.

All the source code is available on GitHub. You can open an issue or comment here if you have any questions.

Lovage

I have been playing with serverless solutions lately. It started with a Django project that was dealing with customer AWS credentials both in background and foreground tasks. I wanted to keep those tasks compartmentalized for security and I wanted them to scale easily. Celery is the common solution for this, but setting it up in my environment was not straightforward. This was as good excuse as any to AWS Lambda. I gave Serverless Framework a try because it was the most versatile framework I could find with proper Python support.

It worked well for a long time. But over time I noticed the following repeating issues.

  1. It requires Node.js which complicated development and CI environments. This is the reason I originally created docker combo images of Python and Node.js.
  2. Packaging Python dependencies is slow and error prone. Every deployment operation downloaded all the dependencies again, compressed them again, and uploaded them again. On Windows, Mac, and some Linux variants (if you have binary dependencies) it requires Docker and even after multiple PRs it was still slow and randomly broke every few releases.
  3. There was no easy way to directly call Lambda functions after they were deployed. I had to deal with the AWS API, naming, arguments marshaling, and exception handling myself.

To solve these issues, I created Lovage. The pandemic gave me the time I needed to refine and release it.

No Node.js

Lovage is a stand-alone Python library. It has no external dependencies which should make it easy to use anywhere Python 3 can be used. It also does away with the Node.js choice of keeping intermediate files in the source folder. No huge node_modules folders, no code zip files in .serverless, and no dependency caches.

Lambda Layers

Instead of uploading all of the project’s dependencies every time as part of the source code zip, Lovage uploads it just once as a separate zip file and creates a Lambda Layer from it. Layers can be attached to any Lambda function and are meant to easily share code or data between different functions.

Since dependencies change much less frequently than the source code itself, Lovage uploads the dependencies much less frequently and thus saves compression and upload time. Dependencies are usually bigger than the source code so this makes a significant difference in deployment time.

But why stop there? Lovage gets rid of the need for Docker too. Docker is used to get an environment close enough to the execution environment of Lambda so that pip downloads the right dependencies, especially when binaries are involved. Why emulate when we can use the real thing?

Lovage creates a special Lambda function that uses pip to download your project’s dependencies, package them up, and upload them to S3 where they can be used as a layer. That function is then used as a custom resource in CloudFormation to automatically create the dependencies zip file and create a layer from it. Nothing happens locally and the upload is as fast possible given that it stays in one region of the AWS network.

Here is a stripped down CloudFormation template showing this method (full function code):

Resources:
  RequirementsLayer:
    Type: AWS::Lambda::LayerVersion
    Properties:
      Content:
        S3Bucket:
          Fn::Sub: ${RequirementsPackage.Bucket}
        S3Key:
          Fn::Sub: ${RequirementsPackage.Key}
  RequirementsPackage:
    Type: Custom::RequirementsLayerPackage
    Properties:
      Requirements:
        - requests
        - pytest
      ServiceToken: !Sub ${RequirementsPackager.Arn}
  RequirementsPackager:
    Type: AWS::Lambda::Function
    Properties:
      Runtime: python3.7
      Handler: index.handler
      Code:
        ZipFile: |
          import os
          import zipfile

          import boto3
          import cfnresponse

          def handler(event, context):
            if event["RequestType"] in ["Create", "Update"]:
              requirements = event["ResourceProperties"]["Requirements"]
              os.system(f"pip install -t /tmp/python --progress-bar off {requirements}"):
              with zipfile.ZipFile("/tmp/python.zip", "w") as z:
                for root, folders, files in os.walk("/tmp/python"):
                  for f in files:
                    local_path = os.path.join(root, f)
                    zip_path = os.path.relpath(local_path, "/tmp")
                    z.write(local_path, zip_path, zipfile.ZIP_DEFLATED)
              boto3.client("s3").upload_file("/tmp/python.zip", "lovage-bucket", "reqs.zip")
              cfnresponse.send(event, context, cfnresponse.SUCCESS, {"Bucket": "lovage-bucket, "Key": "reqs.zip"}, "reqs")

This is by far my favorite part of Lovage and why I really wanted to create this library in the first place. I think it’s much cleaner and faster than the current solutions. This is especially true considering almost every project I have uses boto3 and that alone is around 45MB uncompressed and 6MB compressed. Compressing and uploading it every single time makes fast iteration harder.

“RPC”

Most serverless solutions I’ve seen focus on HTTP APIs. Serverless Framework does have support for scheduling and events, but still no easy way to call the function yourself with some parameters. Lovage functions are defined in your code with a special decorator, just like Celery. You can then invoke them with any parameters and Lovage will take care of everything, including passing back any exceptions.

import lovage

app = lovage.Lovage()

@app.task
def hello(x):
  return f"hello {x} world!"

if __name__ == "__main__":
  print(hello.invoke("lovage"))
  hello.invoke_async("async")

The implementation is all very standard. Arguments are marshaled with pickle, encoded as base85, and stuffed in JSON. Same goes for return values and exceptions.

Summary

Lovage deploys Python functions to AWS Lambda that can be easily invoked just like any other function. It does away with Docker and Node.js. It saves you development time by offloading dependency installation to Lambda and stores dependencies in Lambda layers to reduce repetition.

I hope you find this library useful! If you want more details on the layer and custom resource to implement in other frameworks, let me know.

CloudWatch2S3

AWS CloudWatch Logs is very useful service but it does have its limitations. Retaining logs for a long period of time can get expensive. Logs cannot be easily searched across multiple streams. Logs are hard to export and integration requires AWS specific code. Sometimes it makes more sense to store logs as text files in S3. That’s not always possible with some AWS services like Lambda that write logs directly to CloudWatch Logs.

One option to get around CloudWatch Logs limitations is exporting logs to S3 where data can be stored and processed longer-term for a cheaper price. Logs can be exported one-time or automatically as they come in. Setting up an automatic pipeline to export the logs is not a one-click process, but luckily Amazon detailed all the steps in a recent blog post titled Stream Amazon CloudWatch Logs to a Centralized Account for Audit and Analysis.

Amazon’s blog post has a lot of great information about the topic and the solution. In short, they create a Kinesis Stream writing to S3. CloudWatch Logs subscriptions to export logs to the new stream are created either manually with a script or in response to CloudTrail events about new log streams. This architecture is stable and scalable, but the implementation has a few drawbacks:

  • Writes compressed CloudWatch JSON files to S3.
  • Setup is still a little manual, requiring you to create a bucket, edit permissions, modify and upload source code, and run a script to initialize.
  • Requires CloudTrail.
  • Configuration requires editing source code.
  • Has a minor bug limiting initial subscription to 50 log streams.

That is why I created CloudWatch2S3 – a single CloudFormation template that sets everything up in one go while still leaving room for tweaking with parameters.

The architecture is mostly the same as Amazon’s but adds a subscription timer to remove the hard requirement on CloudTrail, and post-processing to optionally write raw log files to S3 instead of compressed CloudWatch JSON files.

architecture

Setup is simple. There is just one CloudFormation template and the default parameters should be good for most.

  1. Download the CloudFormation template
  2. Open AWS Console
  3. Go to CloudFormation page
  4. Click “Create stack
  5. Under “Specify template” choose “Upload  a template file”, choose the file downloaded in step 1, and click “Next”
  6. Under “Stack name” choose a name like “CloudWatch2S3”
  7. If you have a high volume of logs, consider increasing Kinesis Shard Count
  8. Review other parameters and click “Next”
  9. Add tags if needed and click “Next”
  10. Check “I acknowledge that AWS CloudFormation might create IAM resources” and click “Create stack”
  11. Wait for the stack to finish
  12. Go to “Outputs” tab and note the bucket where logs will be written
  13. That’s it!

Another feature is the ability to export logs from multiple accounts to the same bucket. To set this up you need to set the AllowedAccounts parameter to a comma-separated list of AWS account identifiers allowed to export logs. Once the stack is created, go to the “Outputs” tab and copy the value of LogDestination. Then simply deploy the CloudWatch2S3-additional-account.template to the other accounts while setting LogDestination to the value previously copied.

For troubleshooting and more technical details, see https://github.com/CloudSnorkel/CloudWatch2S3/blob/master/README.md.

If you are exporting logs to S3 to save money, don’t forget to also change the retention settings in CloudWatch so old logs are automatically purged and your bill actually goes down.

Why Kubernetes?

Kubernetes logoKubernetes (or k8s) allows you to effortlessly deploy containers to a group of servers, automatically choosing servers with sufficient computing resources and connecting required network and storage resources. It lets developers run containers and allocate resources without too much hassle. It’s an open-source version of Borg which was considered one of Google’s competitive advantages.

There are many features and reasons to use Kubernetes, but for me the following stood out and made me a happy user.

  1. It works on-premise and on most clouds like AWS, Google Cloud and Azure.
  2. Automatic image garbage collection makes sure you never run out of disk space on your cluster nodes because you push hundreds of versions a day.
  3. Scaling your container horizontally is as easy as:
    kubectl scale deployment nginx-deployment --replicas=10
  4. Rolling over your container to a new version one by one is as easy as:
    kubectl set image deployment/nginx-deployment nginx=nginx:1.91
  5. Easy to define health checks (liveness probes) automatically restart your container and readiness probes delay roll over update if the new version doesn’t work.
  6. Automatic service discovery using built-in DNS server. Just define service and reference it by name from any container in your cluster. You can even define a service as a load balancer which will automatically create ELB on AWS, Load Balancer on GCE, etc.
  7. Labels on everything can help organize resources. Services use label selectors to choose which containers get traffic directed at them. This allows, for example, to easily create blue/green deployments.
  8. Secrets make it easier to handle keys and configuration separately from code and containers.
  9. Resource monitoring is available out of the box and can be used for auto-scaling.
  10. Horizontal auto scaling can be based on resource monitoring or custom metrics.
  11. You can always use the API to create custom behaviors. For example, you can automatically create Route53 record sets based on a service label.

Is there anything I missed? What’s your favorite Kubernetes feature?

Python 3 is Awesome!

pythonToday I will tell you about the massive success that is whypy3.com. With hundreds of users a day (on the best day when it reached page two of Hacker News and hundreds actually being 103), it has been a tremendous success in the lucrative Python code snippet market. By presenting small snippets of code displaying cool features of Python 3, I was able to single–handedly convert millions (1e-6 millions to be exact) of Python 2 users to true Python 3 believers.

It all started when I saw a tweet about a cool Python 3 feature I haven’t seen before. This amazing feature automatically resolves any exception in your code by suppressing it. Who needs pesky exceptions anyway? Alternatively, you can use it to cleanly ignore expected exceptions instead of the usual except: pass.

from contextlib import suppress

with suppress(MyExc):
    code

# replaces

try:
    code
except MyExc:
    pass

There are obviously way better and bigger reasons to finally make that move to Python 3. But what if you can be lured in by some cool cheap tricks? And that’s exactly why I created whypy3.com. It’s a tool that us Python 3 lovers can use to try and slowly wear down on an insistent boss or colleague. It’s also a fun way for me to share all my favorite Python 3 features so I don’t forget them.

I was initially going to to do the usual static S3 website with CloudFront/CloudFlare. But I also wanted it to be easy for other people to contribute snippets. The obvious choice was GitHub, and since I’m already using GitHub, why not give GitHub Pages a try? Getting it up and running was a breeze. To make it easier to contribute without editing HTML, I decided to use the full blown Jekyll setup. I had to fight a little bit with Jekyll to get highlighting working, but overall it took no time to get a solid looking site up and running.

After posting to Hacker News, I even got a few pull requests for more snippets. To this day, I still get some Twitter interactions here and there. I don’t expect this to become a huge project with actual millions of users, but at the end of the day this was pretty fun, I learned some new technologies, and I probably convinced someone to at least start thinking about moving to Python 3.

Do you use Python 3? Please share your favorite feature!

False Positive Watch

While debugging any issue that arises on Windows, my go-to trick is blaming the anti-virus or firewall. It almost always works. As important as these security solutions are, they can be so disruptive at times. For developers this usually comes in the form of a false positive. One day, out of the blue, a user emails you and blames you for trying to infect their computer with Virus.Generic.Not.Really.LOL.Sue.Me.1234775. This happened so many times with NSIS that someone created a false positive list on our wiki.

There are a lot of reasons why this happens and a lot of ways to lower the chances of it happening, but at the end of the day, chances are it’s going to happen. It even happened to Chrome and Windows itself.

So I created False Positive Watch. It’s a simple free service that periodically scans your files using Virus Total and sends you an email if any of your files are erroneously detected as malware. You can then notify the anti-virus vendor so they can fix the false positive before it affects too many of your customers.

I use it to get notifications about NSIS and other projects, but you can use it for your projects too for free. All you need is to supply your email address (for notifications) and upload the file (I delete it from my server after sending it to VirusTotal). In the future I’m going to add an option to just supply the hash instead of the entire file so you can use it with big files or avoid uploading the file if it’s too private.